How A Device Manufacturer Reduces Downtime With ELK
Published on September 05, 2024 by Fabian Stadler
Elasticsearch, Logstash, and Kibana (ELK) are a powerful combination of tools that can help you monitor and analyze your logs in real-time. The system combines the speed and scalability of Elasticsearch with the data processing capabilities of Logstash and the visualization power of Kibana.
In this success story, I want to share how I integrated MySQL in an ELK stack for a device manufacturer to help them reduce costly downtime of their database and improve their overall system performance.
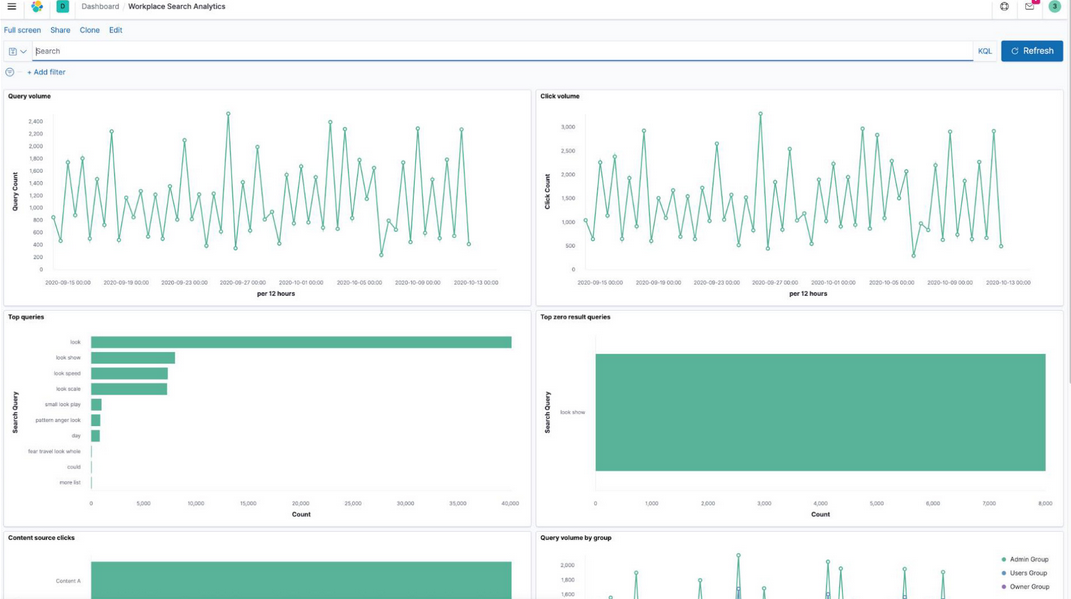
 An ELK stack can help you monitor and analyze your logs in real-time,
Copyright: Elastic
MySQL as the backbone of the company
My client, a national-operating device manufacturer, produces different product lines that are used to diagnose service issues in the automotive field. Their portfolio includes different modules running on different Unix- based systems but also Windows. These use a software that helps techincians to run service tests that are necessary for findinging errors but also to check regulations.
Since not every technician or workshop needs functions for each of the products that can be diagnosed, the software is modular and can be extended depending on the customer's license. This is maintained through a custom administration software that operates on a huge MySQL data warehouse, which also contains other data like customer information, product information, configuration, and is used by many services.
Previous measures to reduce downtime
As one would guess, this MySQL database is crucial for almost any process. For example, whenever firmware updates are published, technicians are notified through the devices to download the latest software and this often includes configuration updates.
Since there are 50,000+ devices in the field, there are periodical peaks in the database load. Issues during those peaks lead to downtime and have an impact on revenue since technicians can't work.
In the past, the client introduced several measures to reduce downtimes, like optimizing the database queries, indexing important tables, and adding a lot RAM to the server. They also used replication to have a real-time backup in case the main server fails. For monitoring, they used CheckMK to track certain metrics like CPU, RAM, and disk usage, but also the number of connections.
Logging in MySQL
In order to gain more insights in real-time, the plan was to connect the MySQL database to an already existing development ELK stack. This would allow to monitor the database performance, track slow queries, and identify connection issues and bottlenecks in real-time. Much like CheckMK, dashboards should list internal metrics and configuration changes for a long-term analysis. However, CheckMK only provided metrics per minute and used some inefficient queries to get the data.
In MySQL 8.0, logs are a lot more powerful and carry better information. Since the client is still in the process of upgrading, I will refer to MySQL 5.7.40 in this article.
In MySQL, there are different logs one can use to gain more insights:
- General log: Logs all queries that are executed on the server |
event_time, user_host, thread_id, server_id, command_type, argument - Slow query log: Logs all queries that take longer than a configured amount of time to execute |
start_time, user_host, query_time, lock_time, rows_sent, rows_examined, db, last_insert_id, insert_id, server_id, sql_text - Error log: Logs all errors that occur on the server |
timestamp, thread_id, server_id, error_code, message - Binary log: Logs all changes to the database
Furthermore, information about the configuration are stored in tables such as
performance_schema.processlist or performance_schema.global_status. Like
this, it is possible to track changes in the configuration over time and see
how the database was used in the past.
A PoC with Python and Jupyter
For a first analysis during an incident, I manually researched the general log
and slow query log with a Jupyter notebook and Python. The client faced the
issue of connection timeouts during peak times as a high number of open
connections were causing the server to run into the max_connections limit.
This is a limit that has to be set in the configuration file and defines the
maximum number of connections the server can handle. Hitting the limit can be
an indicator that there is more traffic than you can handle in a given time.
Normally, increasing it and adding more RAM mitigates the issue, but it did
not.
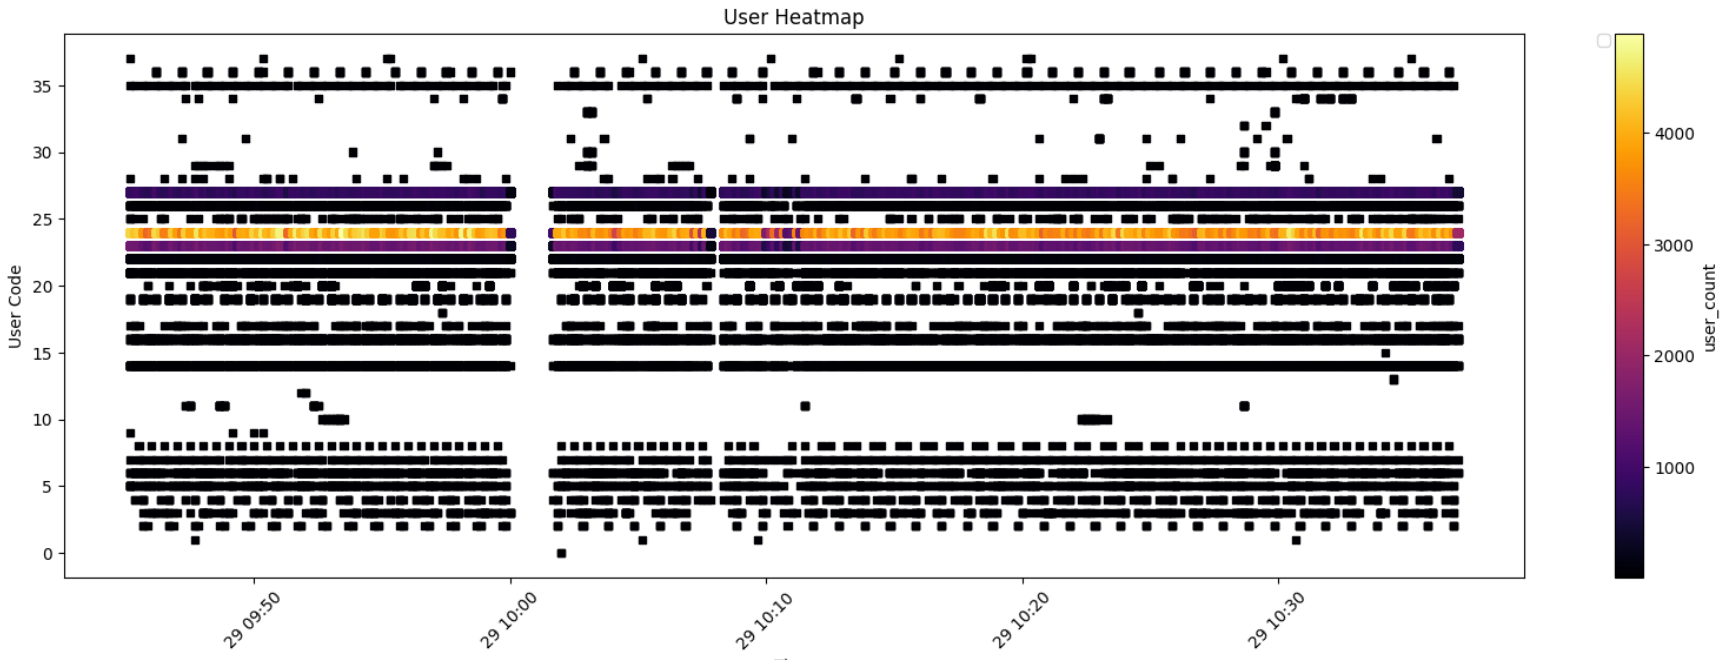
By configuring the logs and using logrotate in a cronjob, the logs were rotated hourly and compressed. This way, it was possible to extract the huge amount of data from the database server and to use it for analysis. In Python, I parsed the logs into the Parquet format, as this is fast for columnar data, and then loaded them into DataFrames. I then sampled the data and created graphs like the number of connections over time, the number of slow queries, which services were using the database, and even checked certain correlations.
 This heatmap shows which database users were very active before and after an
incident at 10am.
This analysis already helped to identify certain services and actors that put unusual load on the database. It also showed periodical jobs that ran through the night and how the database was used during work hours. Like this, it was possible to get the decisive hint that a certain development team had initiated the issue through bad queries.
Further investigation showed, that the MySQL version had a bug that either left dead connections open or did not count them correctly. Like this, the bug occured randomly after an upgrade and was hard to reproduce. An upgrade to the latest legacy version proofed to solve the issue. If we would have known that the past upgrade and the occurence of the issue were related, we could have saved a lot of time and resources.
Transferring the PoC to ELK
Many of the already existing graphs and regular expressions helped to make the transfer of this one-time analysis to ELK. In order to automate the analysis, we used Filebeat to ship the logs to Logstash. In Logstash, you can then use grok to apply regular expressions to the logs, extract values from each line and get the right data types. Since the general log and slow query log have different formats, you have to create two different grok patterns. Further data, also needs additional pipelines. The logs are then indexed in Elasticsearch and can be visualized in Kibana.
Of course, I could not transfer all of the Python logic since some operations are inefficient in Elasticsearch. For example, calculating the number of current connections via general log entries is not possible. But we could create dashboards that aggregated slow queries, errors, and display changes in metrics. The most helpful feature was the ability to filter the logs by time, query type and user.
Since the amount of data was huge, we had to add a retention policy as we were only interested in a few days of data. Each index kept about 50Gb of raw data and within 3 days, the client collected about 200Gb of data. The retention policy helped to periodically delete old data and keep the system running on a rather small 32GB RAM and 500GB SSD server.
Now, I still wanted to track configuration changes and also get the current amount of connections. For this, I created a custom Python service that would always be connected with the database and write the current configuration values as well as the processlist to different files. These were then also shipped by the ELK-stack and indexed.
Since this data is for long-term analysis, another retention policy was added to keep the data for a year.
For debugging, I made the service run queries via an in-built queue, making it possible for multiple processes to use the same connection. This feature was also used to add a custom shell that administrators can now use to connect to the database with this connection and run queries manually. For more information on how to write a custom shell in Python, check out the Python module cmd.
ELK brings light into the darkness
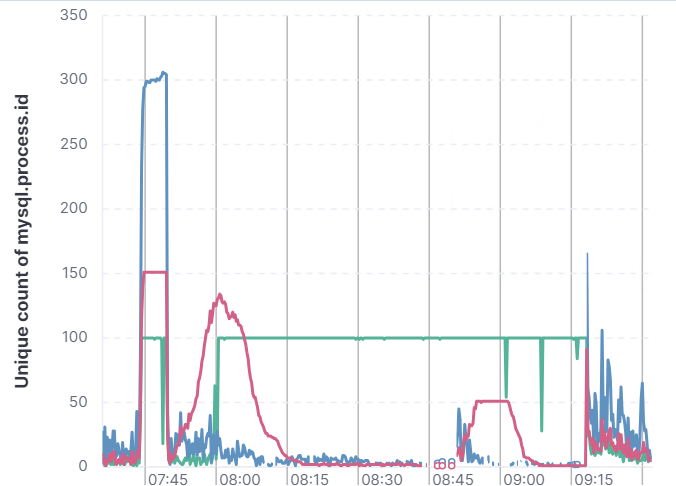
 Tracking the number of connections over time shows you which services use
pooling and which don't.
With the ELK stack in place, the client is now able to monitor the database performance in real-time and identify issues before they become critical. The dashboards provide insights into the number of connections, slow queries, and errors, allowing the client to take proactive measures. The client can also track configuration changes over time and identify trends that may impact performance.
Like this, it is possible to act much faster and more targeted in case of an incident. The single incident we faced during the PoC costed several thousand Euro only for investigation. In the future, it is expected that such incidents can be investigated faster and with less people.
If you have any questions or feedback, feel free to write me a mail or reach out to me on any of my social media channels.